By Kirk Haaland, CycloneFanatic.com Contributor
Another one is in the books too soon as Iowa State once again failed to win a conference tournament game or garner selection to the NCAA or NIT. However, that is about what was expected in this topsy-turvy season that was 2010-11.
I will be doing a multi-part series focusing on statistical data not only of this past season’s team compared with every other ISU team back to 1949-50, but will also do the same routine for the individual players. Here we go…
Shooting: The 3-Pointer
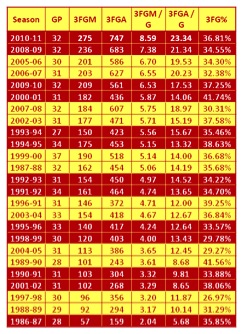
The 3-point line was first introduced into the college game for the 1986-87 and the 25thseason was just completed and it was a doozie for ISU. The 2010-11 Cyclones were the most prolific 3-point shooting team in Iowa State history. Not only did they make a school record 275 3-pointers on the season, they also registered a school record 747 3-point attempts, made the most 3-pointers ever on a per game basis with 8.59, and shot the most 3-pointers ever on a per game basis with 23.34.
This was all done while making their three’s at a 36.81 percent clip—good enough for ninth best all-time. Below is the rundown on all ISU seasons where the 3-point line was in play, sorted by most three pointers made per game.
Shooting: Inside the Arc
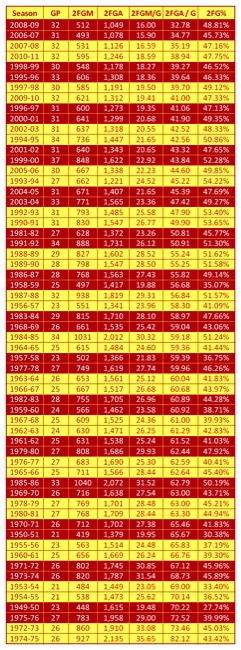
It isn’t surprising at all if you watched many games this season to see just how few two-point shots the Cyclones attempted. In fact, they attempted the fourth fewest two-point shots per game since the 1949-50 season—only shooting 38.94. What is interesting is the three teams immediately above the 2010-11 Cyclones on the list (first, second, and third fewest two point field goal attempts per game), and that is the 2008-09 team, the 2006-07 team, and the 2007-2008 team. So this isn’t exactly a new trend. However, if you remember back to the days of Greg McDermott at ISU you’ll recall a more slow-it-down style of play as opposed to the up-tempo brand that Fred Hoiberg is instilling. Had this year’s team played at a similar pace it would be even closer to the fewest two point attempts per game.
Also, this year’s team made the sixth fewest two pointers per game, the 16thfewest made for a season, the fifth fewest attempted for the season, and shot at a rate of 47.75 percent — that’s the 20thbest all-time. Below is the chart detailing the history of team’s and their two-point shooting, sorted by fewest two-point attempts per game (it is worth noting that any team playing prior to the three point line era will likely have taken more two point shots):
Shooting: The Charity Stripe
Shooting free throws is always supposed to be charity and it was for this year’s team making 72.11 percent of their foul shots on the season—which was ninth best all-time for a Cyclone squad. The trouble came with getting to the free throw line.
This year’s team only attempted 16.47 free throws per game and made 11.88 free throws per game, each were the fourth fewest in school history. The 2010-11 team also shot the seventh fewest for a season, with just 527 attempts and made the 14thfewest for a season with 380. Check below for free throw shooting data for every team back to 1950, sorted by highest FT%:
Scoring Data
The rebranded up-tempo Cyclones scored 74.84 points per game under Fred Hoiberg, which is the 21stmost since 1950 and the best since Wayne Morgan left town. It bested the 2009-10 scoring per game by about 2.2 points.
Another measure that I used to compare efficiency of scoring is to divide points by FGA. This not only highlights the efficient shooting teams but also those that make a lot of three pointers and/or get to the foul line a lot and make a good portion of their free throws. The 2010-11 Cyclones scored 1.2017 points per field goal attempt, which is 24thbest since 1950. Here is all of the scoring data, sorted by most points per field goal attempt:
Some of the Rest
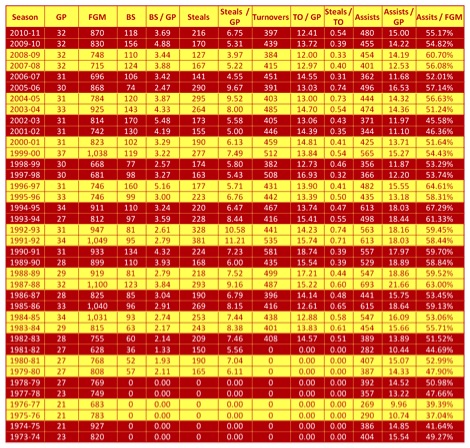
Guards were a presumed strength at the beginning of the season and this next stat is probably a good exhibit of proof, especially when the total number of possessions played is considered (i.e. as an up-tempo team there are more total possessions in a game). This year’s team committed 397 turnovers on the season and even though that may sound like a lot, it is actually the fifth fewest all-time. Further, they had the second best showing all-time in the turnovers per game department averaging just 12.41 turnovers per game—only beat out by the 2008-09 Cyclones that averaged an even 12 turnovers per game (turnovers have been tracked since 1982-83, 29 total seasons to compare).
While the guard court was formidable for ISU this past season, they weren’t especially strong with generating turnovers via steals. While playing more fast paced, or at least attempting to, that is probably best explained by a lack of depth. The team was never allowed to pressure the ball and deny the passing lanes in effort of generating steals. This balance is shown in the fact that they registered 216 steals on the season, which is 16thbest all-time. They also averaged 6.75 steals per game which is 18thbest all-time (steals have been tracked since 1979-80, 32 total seasons to compare).
I don’t usually track the assist/turnover ratio. I easily could but I just choose not to. To me, it is a convoluted stat comparing two things that aren’t all that similar. An assist, is supposed to track the playmaking ability/passing ability/court vision of a player by showing how many of his passes led to direct scores by a teammate—already more difficult than attributing errors to fielders in baseball. The turnover tracks a violation/foul/bad pass resulting in a loss of possession for a team. How are those two things alike? If anything, it simply shows a risk/reward for a given player by saying, “yeah, he may turn it over four times per game but he also makes passes that lead to scores six times per game”. Which, if that is the case and it is simply a risk reward comparison, then why not also include all positive plays on the offensive end for that player, such as made field goals/trips to the free throw line/etc…?
That is where this stat idea came from; an apples-to-apples comparison for turnovers is steals. It compares the number of times that possession is gained by defensive plays to the number of times possessions are lost with turnovers. Granted, just like many stats, the truth can’t be fully recognized. A steal isn’t given for forcing a bad pass that is thrown out of bounds any more than a blocked shot is given by forcing a bad shot. With that said, this year’s team is 11thall-time on the steal/turnover list, mostly due to the exceptionally low number of turnovers.
It probably wasn’t expected coming into the season with just Jamie Vanderbeken and a group of freshmen to man the paint, but the 2010-11 Cyclones blocked a total of 118 shots this season, good enough for 11thall-time (blocked shots have been tracked since the 1979-80 season, 32 seasons total to compare). The 3.69 blocked shots per game is also the 11thbest effort for a Cyclone squad.
Finally, let’s look at those assists I wrote about earlier. The 2010-11 team registered 480 assists on the season for the 14thmost all-time. That translates to an even 15 assists per game, which is the 18thmost all-time. Then, a simple stat to compare just how well a team shares the ball and depends on ball movement to score is Assists / Total Field Goals Made for an “Assist Percentage”. With their 480 assists and 870 made field goals this year’s team had buckets via assists 55.17% of the time. That is the 17thhighest all-time (assists have been tracked since the 1973-74 season, 38 seasons total to compare).
Below is the roundup of all of that data in reverse chronological order:
Next week we’ll dig a little bit deeper into the overall performance of the team and how it stacked up in the history of basketball at ISU.
If you like this kind of analysis and want to see more, visit my site www.encyclonepedia.com
You can also follow me on Twitter @khaal53


