Monte Morris is a better point guard than you, really, he is. Through just a year and a half of playing at Iowa State, he’s starting to make the case as one of the best ever as a Cyclone. That’s a gaudy statment but it also appears to be a true statement.
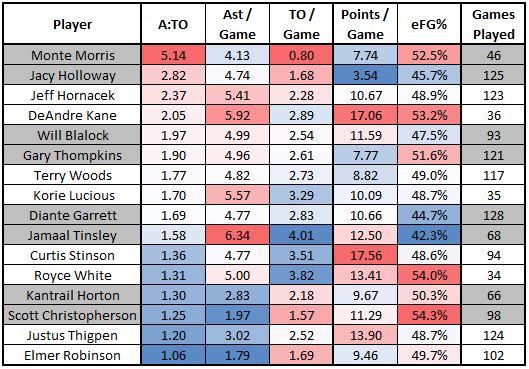
We already know about his ridiculous assist to turnover ratio but he’s efficient in scoring as well. I grabbed a hodge podge of other Cyclone assist men since both assists and turnovers were tracked (1982-83 season) and looked at their career numbers to compare to Morris. It is no surprise that he is outpacing the field with his assist to turnover raio of 5.14 but he’s nearly doubling the No. 2 guy on the list, Jacy Holloway. And Holloway was renowned for taking care of the ball and running the offense.
When you break out the assists per game and turnovers per game you get a clearer picture. Morris is near the bottom in assists per game but he’s also early in his career relatvie to his peers. It should be noted that last year he averaged 3.7 assists per game but in this young season he’s jumped up to 5.6 assists per game.
But, another impressive facet of his numbers is his shooting efficiency. He isn’t high on the list in scoring average (again, last year he averaged 6.8 points per game and this year he has jumped to 11.3 points per game in this young season) but relative to his counterparts, he has shot the ball more accurately as shown by having the 4th best eFG% on this list. Behind Royce White (who lived in the paint with his shots), Scott Christopherson (one of the best 3-point bombers in school history) and DeAndre Kane.
And, if you needed a better visual to compare the assist to turnover ratios….
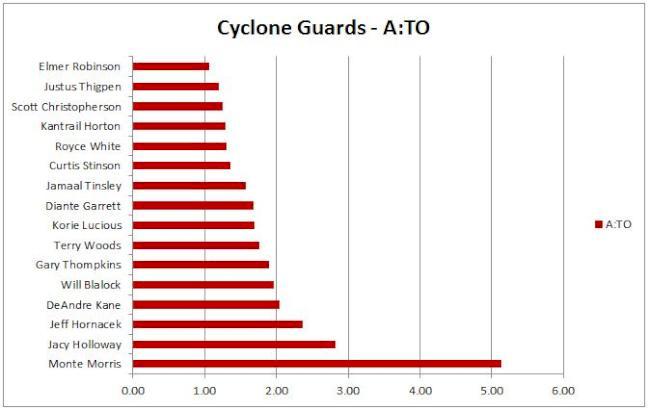
Remember when we wondered about his capabilities without having DeAndre Kane by his side?
Free Throw Defense
It’s a good thing the Cyclones are college basketball’s best team at keeping opponents off of the free throw line. Their tempo adjusted number (FTA/FGA) of 21.7 percent is the best in the land but for the third year running Iowa State, is outside the top 300 teams in free throw defense. In 2012-13, opponents made 72.3 percent of their attempts (312th) when the national average was 69.4 percent, in 2013-14 opponents made 73.2 percent of their free throws (327th) when the NCAA average was 69.9 percent, and so far this year ISU opponents are making 77.1 percent of their shots from the stripe (349th) when the national average is 68.4 percent.
It’s hard to guesstimate equally in the land of tempo-free stats but if you do simple math based on the percentages and free throws attempted per game that extreme free throw percentage from opponents is costing the Cyclone defense 1.14 points per game when compared to the national average. Not too bad, but, if Iowa State’s defensive free throw rate wasn’t the best in the land and opponents shot an NCAA average of 20.13 free throws per game – instead of the 13.10 the Cyclone defense allows – that free throw bonus jumps to 1.75 points per game.
That could be a big deal in the grand scheme of things. The obvious question here is how much can Iowa State control that in the first place? Likely not much but there are some means of control based off of which players are being fouled and sent to the line. However, that would be a deeper excursion for a later day. Especially when free throw defense is seemingly be based on luck far more than anything else.
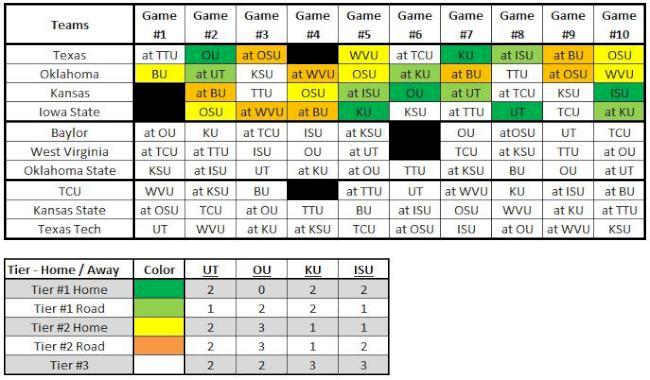
Early B12 Schedule Matrix
In the Big 12, there is no such thing as hiding from your league brethren with the full home-away round robin, but I usually like to look at the schedule checkpoints when it is unbalanced to keep my perspective in check.
So far the league seems to be splitting into three large tiers; No. 1 – Kansas, Oklahoma, Texas, and Iowa State. No. 2 – Baylor, West Virginia, and Oklahoma State. No. 3 – Kansas State, TCU, and Texas Tech
I could be off on those but that’s how it looks to me now. TCU is ranked, which is a pitiful job by the voters when you look at their resume and Kansas State has played some tough games but they just don’t seem right, but everything else looks to be in the vicinity of those tiers.
To win the Big 12 you’ll have to protect home court, beat the tier No. 2 teams on the road and not drop any games to the bottom tier (which may prove difficult depending on how Kansas State plays because they have the “Octagon of Doom” on their side). To aid in the visualization of that, I made a scheduling grid and for the top four teams I color coded their games.
Home games against fellow top four teams are green, road games against top four teams are a lighter green, home games against tier two are yellow, and road games against the second tier are orange.
The blacked out games are either bye weeks or non-conference games (or sometimes both as is the case when Baylor plays Huston Tillotson on January 21st). Below the grid is the chart for the top four teams to show how many games they have in each category.
I’m not sure a whole lot can be gathered, while Oklahoma seems to start with an easier slate than the other three their only two games against top four teams are on the road and three games on the road against the tier two teams isn’t easy, either. The handy thing about this is after a few weeks we can look back on it and see what has happened and how that will shape the future. For instance, Kansas has road games early at Iowa State and at Texas, if they win those they’ll likely be in the driver seat for another conference crown.
I do know that this conference season will likely be a complete blood bath last man standing type deal. Don’t be surprised if it is a shared crown with a record of 13-5. If the top four defend the home court you know that Baylor, West Virginia, Oklahoma State, and Kansas State could easily rise up to be a top tier team at home. It could get messy.