

“They’re supposed to be free.”
“You aren’t being guarded, they shouldn’t be so hard to make.”
“There are two things not long in this world; dogs that chase cars and teams that can’t make free throws.”
Those are just a few of the coach-isms that every level of basketball player has heard more than once in their life that many are now applying to Iowa State. A team that was once near the top of the NCAA in free throw percentage has taken a dramatic turn for a downward spiral.
Through the first nine games this season (through the game with Southern two days after shellacking Iowa on the road), the Cyclones had hit on 162 of their 209 attempts for a free throw percentage of 77.5. That’s a big bonus over the current national average for free throw accuracy of 68.8 percent.
In the last eight games Iowa State has made 103 of their 174 free throw attempts to cash in at 59.2 percent and bring their season average to 69.2 percent.
It is a topic that seems to be surprisingly tied to perception. I say surprising because stats are available to prove this out yet you hear a lot of talk that doesn’t link to what actually happened.
Take for instance the Kansas game where the common thought after the fact was that Iowa State could have buried the Jayhawks had they not shot so poorly from the free throw line, including the front end of one-and-one situations. Yes, Iowa State was 15-26 from the foul stripe (57.7 percent) but had they shot the national average (68.8 percent) they would’ve made just three more (when rounded up) at 18. Further, in the last 10 minutes of the game, the Cyclones were 9-16 (56.6 percent) and the national average would have boosted them to 11 makes (with a very slight round down from 11.008).
But, what is perhaps most interesting, by looking at the play by play, Iowa State didn’t miss a single free throw that was the front end of a one-and-one. Huh. That pretty well ruins the theory that free throws prevented Iowa State from running away with the game, right?
I think the most obvious answer to many of the free throw woes since late December tie back to who is shooting the majority of the free throws for the Cyclones.
Below is a table of each Cyclone player that shows the percentage of team free throws that they have attempted, their free throw numbers for this season, career free throw percentage, and career free throw percentage prior to this year’s data. I broke it out that way so that in the far right column we could compare which player is most over or under the career free throw percentage prior to this season with just this year’s free throw numbers? Make sense?
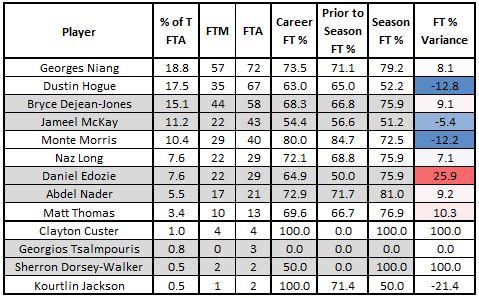
(Jameel McKay and Dustin Hogue only have their second year at Indian Hills included because it was all I could find and it was a very high volume that gave a good sample.)
One of the first things that stands out to me is that McKay has attempted around 11 percent of all Cyclone free throws when he has only played in eight of the 17 games this season and right around 25 percent of the total minutes. He gets to the line a lot. And while he wasn’t expected to be a great free throw shooter, his 51.2 percent (thanks to the 7-9 outing against Kansas State) is the third biggest dip on the team from his career percentage of 56.6 headed into this season.
Monte Morris has the second largest (relevant) drop off, though he is still on the smaller sample size with just 53 career games in the books. But perhaps the most noticeable plunge comes from Dustin Hogue, who was a 66.8 percent free throw shooter prior to this season and he’s only making 54 percent this year. That is especially impactful because he has gotten to the free throw line the second most.
But, to get back on track to my above thought about the individuals with their number of attempts and their own personal free throw percentage being the biggest contributor to how many Iowa State makes; it’s an obvious statement but I think the visualization of it will help.
I took each game broken out and the number of attempts by each player and applied their total career free throw percentage to project the number of made free throws to expect each individual to make. For example, Hogue is a 63 percent career free throw shooter so if he attempted 10 free throws in a game, his projected number of made free throws would be 6.3.
In each game, I then summed up all of the projected makes from each player to arrive at a projected number of makes for the team. To attempt at keeping it more accurate, I did not round any of the makes though I do understand that there is no such thing as 0.3 of a made free throw.
After all of that, I graphed every game below to show the actual number of free throws made (blue bar), the number they should have made based off of the projections above (red bar), and added the green line to depict the number of attempts in each game. So any game where the blue bar is taller means that Iowa State outperformed the expected.
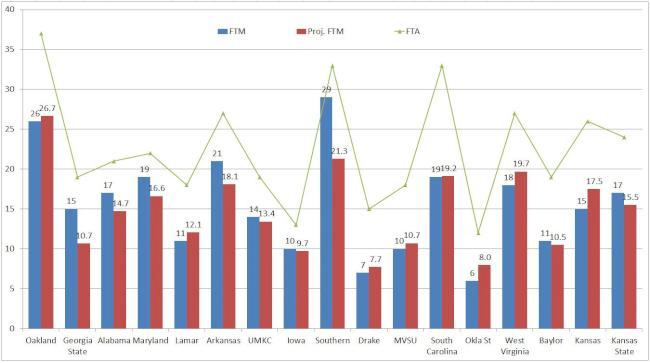
As you can see, very often the actual makes is very close to what you’d expect. And to highlight how fickle this can be, let me reference back to the Kansas game again. Iowa State made 15 to compare to the projected 17.5 but one of the best free throw shooters, Bryce Dejean-Jones, went 4-8 from the stripe.
For the season, Iowa State is still an above average team from the free throw line – barely. But that is obviously trending downward in the second half of the games that have been completed so far. As mentioned, the NCAA average is 68.8 percent while the Cyclones are hitting on 69.2 percent of their attempts.
Lastly, and this ties in to the concerns that some may have about team’s using the “Hack-a-Shaq”, or “Hack-a-Jameel” method, how do free throw possessions compare to regular possessions? Well, it gets pretty messy with the formula for estimating possessions versus using the hard play by play data but, there is a way to get close.
But, to get to the chase, free throws are attempted in a variety of different quantities and conditions but to account for possessions that are used some smart guys use 0.475 as a multiplier of total free throws attempted to be used as part of the formula to arrive at an estimated possessions per game. We can use that with total free throw attempts to get possessions used with free throws. Then, use total free throws made to get a points per possession metric on free throws for each team.
Below is the table for each Big 12 team, and the far right is the free throw PPP bonus over that team’s average PPP. Notice that even the worst free throw percentage teams outperform the PPP from standard possessions at the free throw line.

In concept, 1.0 PPP is considered the goal for most teams so even a 50 percent free throw shooting team would be able to hit that marker. So, in short, I wouldn’t be overly concerned with opponents fouling to stop the Cyclone offense.
Does Iowa State need to get better at making free throws? Yeah, more than likely. Is it a great team area of concern or more due to which guys are shooting below expected and getting to free throw line the most often? I think the answer there is obvious. None of this is to say that they don’t need to or can’t improve. It is more to point out that we shouldn’t be overly surprised by the end result.
Bemoaning the misses or – worse yet – sending pointers to improve team free throw percentage to Fred Hoiberg isn’t really necessary or a driver to help the cause.
Making free throws is a big deal. Otherwise, at some point this March you’re likely to find your team looking like every dog that has ever chased cars did in the end. Dead.


