


Karl Chevrolet gives you peace of mind when you purchase a GM Certified Pre-owned vehicle. We have been the #1 GM Certified dealer in the nation for 10 consecutive years. Before you make your next purchase, come see why more people nationwide drive a Karl Chevrolet Pre-owned vehicle than any other dealer-There is a difference, Come see why TODAY!!
Depth has been a primary topic of concern for many all season long with this Cyclone team and often many have been left to wonder on the lingering consequences of how the team performs at the end of games while dealing with fatigue. Exhaustion that is hypothetically worse than the opponent because of prolonged minutes.
I typically don’t buy into lack of depth as far as bench minutes as a having a huge impact on overall performance, though some bench minutes are obviously needed if for nothing other than getting two or three breaks throughout a game. Maybe that view is clouded and biased because some of the best Iowa State teams in history had guys playing 40 minutes per game and maybe two serviceable guys offering rest to the starters, but in a very limited fashion.
Keep in mind that I’ve already gone on rants about bench scoring (and probably all bench production) being useless in how it relates to winning or success in the measured category.
This all indirectly relates to one of the biggest issues with Iowa State this season; why are they losing games down the stretch? Since simple answers like randomness and fluke plays never satiate the fan’s need for knowing and accepting why, we come up with other reasons. Things like “leadership”, the “will to win”, “toughness”, and most famously this season, “DEPTH”.
I didn’t start down this road of research with this conclusion—or lack thereof—in mind, but as the numbers came together it was pretty clear to me how it would be perceived.
I was re-watching the home game with Oklahoma for obvious preparation reasons so that I could develop my mental scouting report for the first round of the Big 12 Tournament when it kind of dawned on me and dots connected.
All of Iowa State’s losses have been there for the taking until the bitter end this season but in many of them it seemed that it wasn’t the unreliable defense that let the Cyclones down. Instead, it was the elite offense sputtering at inopportune times.
To get to the bottom of this, I went through the play-by-play data for Iowa State’s 10 losses and I picked some of the close wins (Iowa, at Cincinnati, Oklahoma, Kansas, and Texas) and analyzed the last five minutes of regulation AND overtime for the three overtime road losses. I compiled the shooting numbers, possession data, and turnovers to compare each game but I also put the line in with what they’ve averaged in Big 12 play.
There are separate lines for the last five minutes of regulation and overtime for those three games and I put a column in to show the change in PPP in the given five minutes as compared to the first 35 minutes of the game.
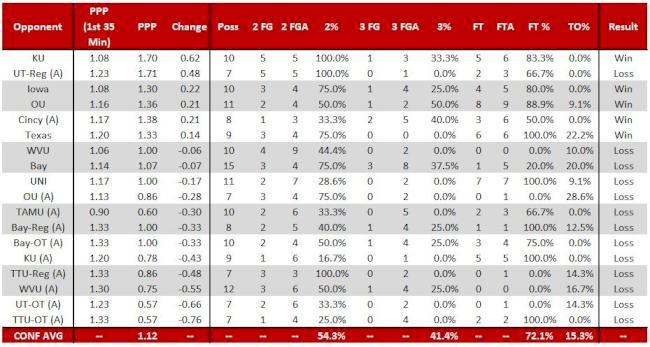
I realize that isn’t the easiest thing to look at and make clear sense of, but I wanted to show you all of the data in case you wanted to see it.
The summation table of all of this for the above games by wins and losses is below:
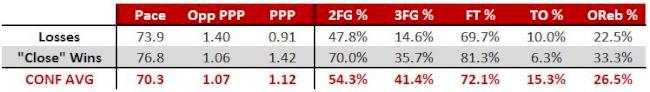
There is a lot that should probably jump out at you on this table, most notably the scoring efficiency for each team in wins and losses. The winning teams are obviously inflated by some late free throws and the losing team is likely hurt by hurried and more difficult shots, but the contrast is stark and this does include five minute spans to end games, not just the waning seconds.
Iowa State’s shooting inside the arc is a noticeable drop, even from just the season average but the 3-point shooting absolutely plummets in the final five minutes of losses. In the 10 losses, Iowa State is 6-41 from outside the arc in the final five minutes of games and three of those makes were Monte Morris at the end of the home game with Baylor. (And, yes, I realize some of this is post-mortem analysis in that making fewer shots results in fewer points and usually more losses).
But across the board the numbers are very obviously improved in the victories.
But, why?
Depth is quantifiable and very tangible; however, the effects on a team due to a lack of depth are most definitely not.
Are more shots not going in because of fatigue? Or is it the quality of shot in late game situations, or how the defense is playing, or your favorite explanation, random variance? I tend to believe from being around the game for a very long time that it isn’t just a fatigue issue but at the same time I cannot unequivocally say that it has no role in the matter.
Were they “less tired” or “tougher” in the games where they made shots at the end?
Adjusting Opponent Offensive Rebounding
The cheerleaders of KenPom.com seem to love it mainly because it adjusts for strength of schedule and puts all teams on a level playing field when evaluating their quality. Agree or disagree with the end result of the ratings, I think everyone can agree it is a noble path to pursue.
But, only tempo and the scoring numbers are adjusted for competition level. If a team plays the 20 best offensive rebounding teams they are not likely to have a very good defensive rebounding percentage.
Earlier this season and in previous years, the Cyclones have been able to keep opponents off of the offensive glass with some success, especially relative to the lineups they often employ.
Because Iowa State appears to play against a decently tough schedule and how they hit the glass, I was curious what it would look like to try and adjust their performances to how an “average” offensive rebounding team might perform.
Using the NCAA average for offensive rebounding percentage and the given opponent’s season long offensive rebounding percentage, I plotted how Iowa State did against each team. The y-axis is technically difference in the opponent offensive rebounding percentage that actually happened compared to what would’ve been expected. Hold them below expectation and the number is negative (and at the top of this inverted graph) or let a team outpace the expected offensive rebounding percentage and the plotted points will drop.
Across the bottom axis is every game in chronological order from left to right. Starting with the home game with West Virginia and through the home game with Kansas State, Iowa State experienced a rough patch.
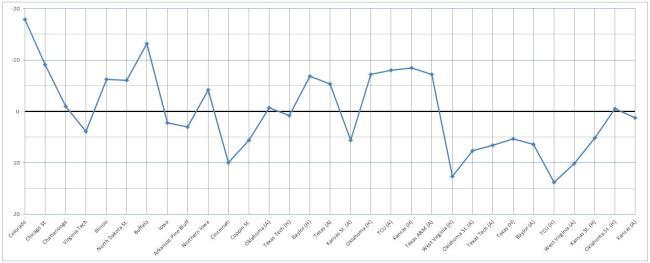
Some of those teams are susceptible to causing those problems but some of that was also likely due to no Jameel McKay for three of the eight games. There may not be a ton to actually conclude other than the fact that Iowa State has done well in certain games in keeping opponents off of the offensive glass. Some of them are even the better offensive rebounding teams in the country like Colorado, Baylor, Texas, or Kansas.
Every defensive rebound this team can grab is gigantic as its defensive efficiency is wallowing just outside the top 100. If they had on average been grabbing two more defensive rebounds per game that had been leading to two point makes for opponents this season, their defensive scoring efficiency would likely be inside the top 50.
That’s how narrow the margin can be.


