
It was a Twitter question from last week focusing on an often discussed topic from the 2013 Cyclone football season; “What do the defensive stats in the first quarter look like?” Of course, the underlying issue here is about the defense that often seemed to start strong, only to wilt under continuous and insurmountable pressure from a bad offense. Short drives and bad field position slowly crushed any dreams of the defense early and often last season.
While this issue had been delved into in the past, I’m sure, I took a look at it again. I compared the results of all drives against FBS opponents for the ISU offense, the ISU defense, and the rest of FBS (since it is FBS vs FBS games only the offense and defensive numbers would be the same, hence just one “rest of FBS” listing).
I looked at all four quarters and each quarter includes drives that ended within that time frame. If a drive started in the first quarter and ended in the second it got put in with the second quarter (imperfect, I know, but drives work like that and this was more about drive results than individual plays).
But, I think the main point of what I was digging for comes across in one bar graph about the first quarter of all FBS games from 2013.
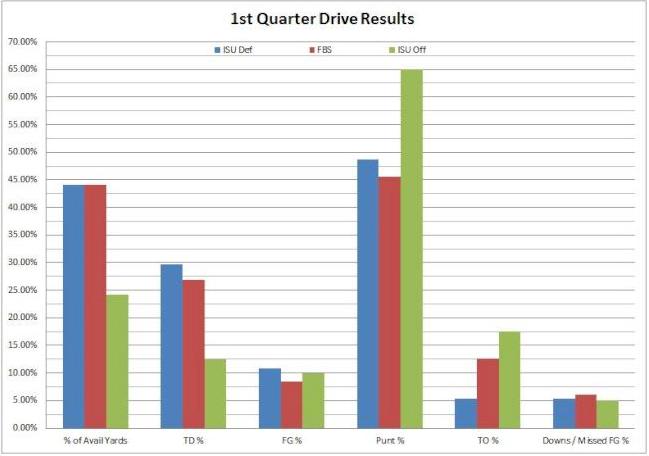
Looking from left to right you’ll immediately notice that in one of the better ways to determine how well the ball was moved, percentage of available yards gained (yards gained on a given drive divided by the yards available with starting field position), that the ISU offense left the defense hanging by gaining around 24 percent of available yards. Yet, the defense hung in with the national average around 44 percent.
When it came to scoring touchdowns the defense was slightly worse than the expected FBS average around 29 percent, while the offense was way, way down at 12.5 percent. (Side note: Iowa State scored just four touchdowns in the first quarter against FBS opponents last year – Tulsa, Oklahoma State, Kansas, and West Virginia).
On to the next concerning category; punt percentage. The Cyclones punted on 65 percent of their drives that ended in the first period. Sixty-five. SIXTY-FIVE! That is no bueno. Compare that to the FBS average of 45 percent and you can easily see that. The silver lining – the type that isn’t the lightning in the storm cloud – is that the ISU defense was able to force punts more often that the national average. Kudos to those kids.
But, the one area the Iowa State team was subpar as a whole was with turnovers. Not only did the offense turn the ball over at an alarming rate on 17 percent of possessions but the defense lagged far below the FBS average of 12.5 percent by earning a take-away on just over 5 percent of possessions. It was the one major area where both units were on the wrong side of the FBS average.
Below is the table of data for the above graph but it also includes average field position, yards per play, and points per possession as well as the second, third, and fourth quarter data. There wasn’t a method to the madness but I roughly picked out the “bad” spots for ISU by changing the font to red while the “good” was, you guessed it, green.
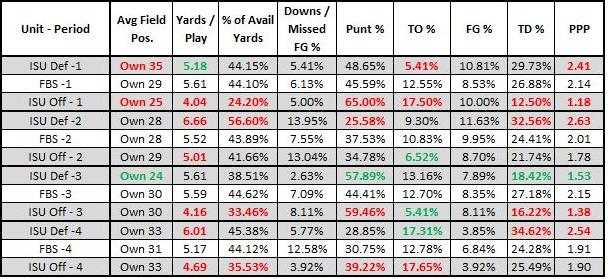
As you can see there is more red than green. A lot more red. The first thing to jump out at me is that in the first quarter the offense struggled pretty much across the board. The defense wasn’t great, but they hung in there and even did better than the FBS average on yards allowed per play.
The offense has a slight improvement overall in the second period but then the defense appears to drop off in almost every facet. The offense is still far from world record breaking but it is a clear betterment over the first period stats.
Out of halftime, the Cyclone defense almost looks like a very strong unit. Attribute it to coaching or who knows what but across the board they were very stout in the third quarter. Paring down the touchdown percentage and scoring efficiency and upping the punt percentage considerably. Though, it’s mostly for naught as the offense again struggled to do much of anything well.
In the fourth quarter the defense was largely “meh” while the offense was more of the same poor showings. The biggest thing I see is with the defense and their scoring collapse where they give up their highest touchdown percentage of any quarter.
One obvious thing to draw from all of this is that never is the offense what you would consider impressive. One other over-reaching point is that it is interesting to see how the turnover percentage seems to somewhat correlate to the field position battle. When turnovers were avoided better field position was almost always had and vice versa for defense.
There’s a lot of data there but the one general point is that the offense was never great in 2013 but you can easily see how slowly they often started games. Whether or not that specifically wore out the defense and fatigued them more quickly is still an unknown, but I think we can reasonably infer from this, but mostly what we saw, that the offense adversely affected the defense.
I am intrigued by what is behind the strong showing in the third quarter for the defense. Wally’s adjustments? Random coincidence? It’s a complete mystery but it is semi-refreshing to see.
The fast starts were rarely there for the ISU offense in 2013 but likely will need to be for any hope of a successful season in 2014. Putting points on the board from the start and reserving defensive manpower early in games will be a must to turn L’s into W’s.


