

A lot of, ummm, stuff happened in Ames on Monday. Stuff that not only caused a whirlwind of local media reports but the national media quickly picked up and weighed in on Mark Mangino exiting the Iowa State Football program too.
A lot of things likely went into what happened behind the scenes that spurred all of this on but was on field success a factor as well? Clearly the Cyclone offense never took off to new heights in the past season and a half under the tutelage of Mangino, but was it that bad?
That will be gotten to but one of my beliefs for a lot of the friction between Paul Rhoads and Mangino was Mangino’s inherent reluctance to want to run the ball. Even if that is the biggest strength for this team. Sure, there may have been many other conflicts that may have even been bigger problems but I think that was at the heart of the issue.
From talking to my buddies that are more football aficionados than myself, they also tend to believe that Mangino largely ran a pass first offense that wasn’t well tailored to the strengths of the team and relied too much on the assumption that Iowa State could out-talent some defenses, which in fact has been pretty rare in Ames.
To get to the bottom of it, I looked into some things and play calling tendencies for Mangino at Iowa State and as far back as I could in his career with stats to support what I was looking at. The chart below shows Mangino’s offenses yards per rush, percentage of plays that were rushes, percentage of yards from rushing plays, and yards per pass. All of those are then compared to the FBS average for the given year. Mangino’s numbers for each data point are then compared to the average and the greater number is colored blue and the smaller number is red.
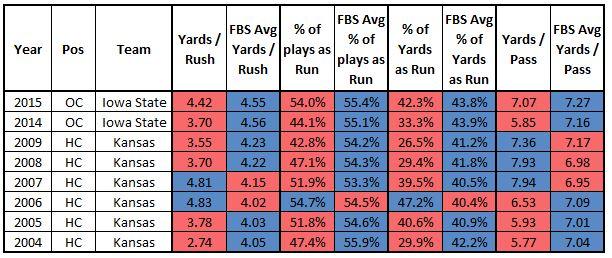
As you can see, very rarely has Mangino opted to run the ball more than the national average, but, also very rarely has he had a team that was averaging more yards per rush. Plus, you can’t underestimate how much these numbers are affected by coaching at schools with traditionally much less talent than the rest of their conference.
I’m not sure there is much conclusive information here, other than it tends to support the theory I had before I looked it up. In many of the years where his yards per rush were in the neighborhood of the national average, he still opted to run the ball seven to 10 percent less often.
But what about Wally?
That’s been a popular question from some this week. Which is a bit fair when everyone remembers the gaudy numbers that his defense has allowed in the past few seasons. But again, I don’t think anyone believes that Paul Rhoads walked into the football offices on Monday morning prepared to fire Mangino over performance, and performance alone.
But, for a moment let’s entertain that it did go down like that; it was all performance based.
So let’s compare how the coaches did purely by the numbers. In each year there is a row for the offense and defense, all of the stats listed are from the perspective of the given unit and their opponent. Some of this gets a little confusing, though it is really quite simple. But I broke down yards per rush, yards per pass, and adjusted scoring efficiency for Iowa State’s offense and defense the past two season.
The opponent numbers for yards per rush and yards per pass are calculated by the opponent performances in all of their games minus how they did against Iowa State. The scoring numbers are merely the adjusted scoring efficiency per possession for Iowa State as well as their opponents. All of these numbers and a lot more can be found at cfbanalytics.com.
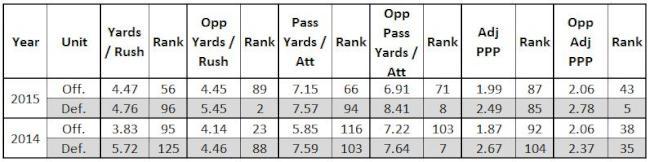
So far this year the offense has the 56th best rushing offense as compared to the Wally having the 96th best rushing defense. So, point for Mangino? Not really. The opposing defenses rank 89th in yards per rush allowed where the opposing team’s offenses have the 2nd best rushing efficiency. The story is basically the exact same for the passing numbers in 2015.
The scoring numbers are pretty similar, the offense and defense are nearly identical in ranking but the opposing team’s offenses have been ranked 5th this season and opposing defenses rank 43rd.
In 2014, the rushing numbers would favor team Mangino slightly but neither would be considered impressive. In the passing game, the Cyclone offense struggled badly and the defenses they played ranked at 103rd while the defense ranked 103rd in pass yards per play allowed but they played the seventh toughest schedule in yards per pass In the country.
Looking at the scoring numbers, it is similar to the rushing numbers. Neither were good and they both played units that ranked in the 30’s.
Long story short, neither coordinators have been setting the world on fire but when you look at the strength of schedules that they have faced in each area, it is pretty clear the defense has had a tougher row to hoe.
Will this all work? It’s pretty hard to say right now, but it was pretty clear most of this season that the Cyclones needed to run the ball more often than not. That needs to be the focus because it is the strength, but also because it can lower possessions in games against explosive Big 12 teams.
I tweeted earlier this week that Iowa State hasn’t beaten a non-Kansas Big 12 team at home since Baylor on October 27th, 2012. Jake Knott’s last game and Steele Jantz threw five touchdowns. That was 1,098 days ago and 11 games. So really, what is there to lose?


