

Our eyeballs have been seeing it for a while now. In the past few years, second quarters have ended disastrously more often than not for Iowa State and it happened again on Saturday.
Sure, we all predicted the three and out by the Cyclone offense with just over two minutes remaining and how it would more than likely lead to points for the Cowboys. But, the defense bowed their neck and kept the drive to just a field goal before the real disaster, when crap really hit the fan.
I’m not going to go into the details because that’s been done. Ultimately though, it was another example of ISU giving up points at the end of the second quarter, which can cause huge swings in games; especially if the opponent is receiving the kickoff to start the second half.
It wasn’t the first time, either, that I was bombarded with inquiries about analyzing the failing of Iowa State in recent years in these situations. It’s been considered before but it was always one of those things that I felt was unnecessary because we all knew it was bad.
But, this time it was asked enough I figured I could go ahead and quantify it.
I went back to 2011 and ran the numbers up to before this last weekend’s games on how each team did on offense and defense in drives that ended with less than three minutes to play. Including three years plus this season seemed like a fair time frame and enough data to account for, but there wasn’t any hard and fast reason for stopping at 2011 other than adding more years would add more work.
Below are the basic results showing the FBS average in each category, how ISU fared, and the ranking for the Cyclones in each breakdown:
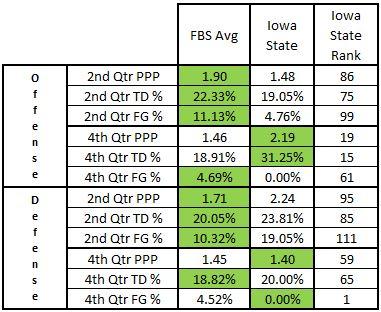
The “PPP” listed is points per possession that ended in the final three minutes and the “TD % and “FG %” are the percentage of possessions that ended with those type of scores. For the purposes here, I’ll mainly look at the PPP numbers because that is the nitty gritty of what we’re talking about.
As has typically been the case, the ISU offense is in the bottom half and doesn’t compare favorably with how the numbers shake out at the end of the second quarter. Which stands to reason that if a team’s offense struggles throughout all portions of the game it is unlikely they’ll be able to excel when one other constraint – time – is added.
That changed a bit from the second quarter to the fourth quarter and the first reaction here is to think that it is the offense scoring late points in blowout losses. That could be the case, I didn’t go back to look game by game, but it could be a mix of that and the rest of FBS offenses letting off the gas with scoring that arbitrarily accelerates ISU’s offensive numbers.
But, for the payoff of what we’ve all been bemoaning…the second quarter points allowed by Iowa State. The Cyclone defense chimes in at 95th in terms of points allowed per possession in the last three minutes of second quarters at 2.24 PPP. It almost seems like that number should be worse, but the ranking kind of says it all.
The fourth quarter numbers improve a bit for the defense just like they did for the offense. And again, the question has to be asked, “What is the primary cause of this?” Without looking game by game or breaking it down further, the answer can’t be found for sure but our gut reaction will be that it is the effect of games already being decided (one way or the other), so less scoring is done.
For reference, in the same time frame as above, FBS teams as a whole have given up an average of 2.08 PPP. In that same time frame, the Cyclones have allowed 2.17 PPP. The takeaway from that is the average FBS defense allows less scoring (1.71 ppp from the table above) at the end of the second quarter while the Cyclones allow more (2.24 from the table above), even if it is such a small difference.
Without going crazy with bell curves and t-tests, those numbers are important and this is why; at the end of the second quarter the FBS average is for defenses to improve their ppp allowed by 0.37 while Iowa State’s defense fell below average by 0.08 PPP. That is a 0.45 PPP swing to the negative for the Cyclones as compared to the FBS average and accounts for nearly 25% of the average PPP allowed by FBS teams at any point of a game. That’s a big deal.
Confirming what everyone knew and the quantification of what we thought we were seeing is as bad as we would’ve guessed. It is yet another area for improvement for a Cyclone football team that has struggled closing out halves more often than not in the past two years.


