

Read more of Kirk’s great work over at enCYCLONEpedia.com.
It has pretty well become a trend over the course of the past decade in college football; the offenses have evolved to something that the geniuses of the game could have never envisioned 20 years ago, let alone 50 years ago. There are still the teams and coaches that prefer to line up in power formation and slobber-knock the defense into submission but there are even more that spread it out and speed it up. Those football minds of yesteryear lived by the tenants of defense and field position.
Not without good reason and not because it doesn’t still apply today but Iowa State is currently on a run of quite the anomaly with their offense.
What anomaly? So far this season, the Cyclone offense has taken the field for 53 possessions in total and they have mustered 13 total touchdowns. Of those 53 possessions they have been pinned inside their own 11 yard line on seven occasions. On five of those possessions, they went on to score touchdowns. When the search is expanded to encompass all possessions that started inside their own 20, you’ll find 14 Cyclone possessions with six touchdowns scored.
As the field position improves, the touchdown rate dips…drastically. (Note that the field position breakdown in the first column is shown as yards from the goal line. Meaning that “80” would correspond to a team’s own 20 yard line, 60 would be a team’s own 40 yard line, and so on.)
The touchdown rate for the subsequent field position starting points can be seen on the chart below. As well as where drives started that ended with a made field goal, a punt, or a turnover.
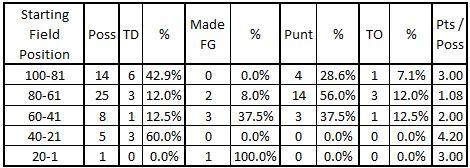
On the far right is the points per possession scoring for the Cyclone offense. All told, the Cyclone offense chimes in at 2.06 points per possession this year. The only common starting field position where the offense is able to achieve that is with those drives that start inside their own 20. For further comparison, for all drives combined the total touchdown rate is 24.5%, they punt on 39.6% of possessions, and record turnovers on 9.4% of possessions. It is quite strange that the drives with the worst starting field position are the best statistically in these categories.
To add more context to this field position quandary, here are national averages for every FBS team excluding Iowa State.
The national average of touchdown rates for drives that start inside an offense’s own 20 yard line is 19.38%. Again, Iowa State is at a whopping 42.9%.
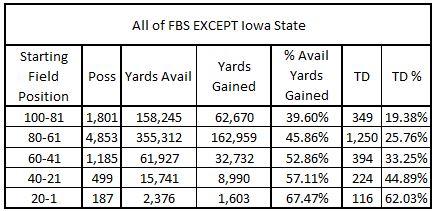
The other columns added on this chart are in relation to the yardage gained on average by field position in terms of the percentage of total yards a team could gain based from their starting point.
You’ll see that the percentage of yards gained increases extremely steadily. A consistent gain of 6-7% until team’s start inside the red zone and they get a 10% jump. The story is pretty similar for touchdown rates. But how does that percentage of available yards gained compare to the Cyclones?
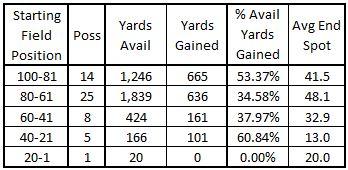
Once again, from the worst field position possible Iowa State is waaayyy out performing every other offense by gaining 53.37% of available yards on drives that start inside their own 20 yard line. But that trend doesn’t continue in the next two field zones and their averages drop steadily. Just for further analysis, the column on the far right shows you where the average drive ended after starting in the given field position. The only other field position where Iowa State is out gaining the national average by percentage of yards gained is with drives that start between the opponent’s 40 yard line and 20 yard line. But that sample size is pretty small.
So what do we make of all of this? I wish I could tell you more. Perhaps it is just an anomaly. Here is the little I can add to the equation. From worst to best field position for all plays (this isn’t looking at it by drive but by individual play that is run in a single field zone) the Cyclones average 3.5 yards per carry, 4.0 yards per carry, 3.2 yards per carry, 5.6 yards per carry, and 2.6 yards per carry.
Maybe the most noticeable trend in passing and rushing stats regarding this is the regression of Sam Richardson’s completion percentage as he gets closer to scoring. From worst field position to best it goes from 72.7% to 70% to 56.8%, to 51.7%, to 50%. But the issue with forcing that as the explanation to Iowa State scoring so well on drives that start from inside their own territory is that in those drives they eventually progress to better field position and continue to move the ball.
Which brings us to perhaps the biggest contributor to the touchdown rate from bad field position question…The second possession against Northern Iowa the Cyclones started on their own 11 yard line and it took six plays to gain the first 30 yards of the drive but the final play was a 59 yard touchdown pass to Justin Coleman. For Iowa State’s first touchdown against Iowa on a drive that again started on their own 11 yard line it took five plays to gain 22 yards and the Quenton Bundrage made a play and turned a 10 yard catch into a 67-yard touchdown. Then, Quenton Bundrage had the 97-yard touchdown catch against Texas.
All told three of those six touchdowns from possessions starting inside their own 20 yard line for the Cyclone offense can be at least mostly explained by the big play. The Bundrage touchdown against Iowa and the Coleman touchdown against UNI could’ve just as easily happened on the first play of a drive starting from improved field position.
Perhaps the situation isn’t best described by the anomaly of the increased touchdown rate in accordance to field position but more the coincidence of when the big plays have happened.


