

Believe it or not, there are some positive metrics out there for the Iowa State football team this year. Maybe that is a surprise to you or maybe you think it has to do with the scoring outbursts in the last two games against Texas and Toledo, but it isn’t. All year long, Iowa State has done pretty well with third down conversions on offense. Like top 20 in the country well.
As of today, the Cyclones have faced 111 third down situations and they have converted on 53 of them for a percentage of 47.75. That may seem a bit underwhelming but it actually places them at 16th in the country. That is a noble number and probably a surprise given the perception of general discontent with the offense for this season as an entirety.
As usual, there is more to the story. When I first saw the success that Iowa State was having on third down, my interest was piqued because I was already aware that first down was largely a struggle so far this season. See below:
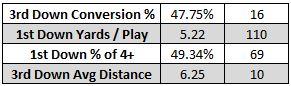
On first down, Iowa State is averaging 5.22 yards per play which is just 110th in the country.
As you move down that table, you’ll also see that Iowa State gains at least four yards on 49.34 percent of their 1st down plays. That could certainly be better but that is 69th in the country and could also be worse. Not great but not bad, and just past the middle of the 128 FBS teams.
Lastly, on that table you’ll see the average third down distance for the Cyclones comes out to 6.25 yards, which is the 10th best in the country (meaning only nine FBS teams average their third down plays to be shorter to gain a first down.) Of course, that number can be a bit misleading in its own right. Going roughly a half yard on each side of ISU’s 6.25 (in practice it ends up being from 5.92 yards to 6.92 yards) and you’ll encompass 55 of the 128 FBS teams. The point there is that the separation is very, very small.
So what is a guy to do to get more answers? We know that all third downs are not equal in that they have varying distances to earn a first down and that plays a large role in success. I broke out third down situations by distances of 10+, 7-9, 4-6, and 1-3 yards. That will help to better understand the conversion rates. Also, I did the same for second down. In part because I think second down is very much overlooked. It is crucial in bridging the gap from a good or bad first down to ultimately land on a third down that can be as easy to convert as possible.
For first down I operated under the basic (wrong) assumption that all first downs are created alike in terms of distance to go and just ignored them going forward.
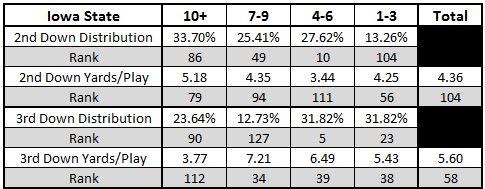
First off, look at the second down numbers, the top row is the percentage of time the range of distances was faced on second down, and below them is the corresponding rank versus all other FBS teams. The larger the percentage the bigger the number is for the rank (even though it is better for the percentage to be lower at that distance range). So in the “10+” category where you’d prefer to have a lower percentage the rank to go with it is higher. (I know it’s confusing, but when the distance is 1-3 you want the percentage to be higher and the rank to be lower and keeping it consistent throughout the splits is better than trying to arbitrarily change it in the middle ranges…at least I thought so.)
The first note for Iowa State is that their “high” ranking at “10+” is actually telling you that they are top 40 at avoiding 10+ yards when the play is snapped on second down. At 4-6 yards, ISU is the 10th most frequent offense with that distance to go, which is very much a distance that can be converted, especially with two plays to do so. In turn, and likely very much related to the 4-6 category being so frequent the 1-3 category is rarely a scenario on 2nddown for ISU with just 13.26 percent of their snaps being at that distance on 2nd down.
Below each of those scenarios I included the yards per play and the rank of that average against the rest of the country. Averages aren’t perfect but the general trend there is that the offense gains yards and a below par rate.
On third down, the slow and steady success of the Cyclones begins to take hold. Their percentages for the distances of 10+ and 7-9 yards are very, very low and the corresponding rank shows that. Only four teams in FBS see 4-6 yard distances on 3rddown more often and only 22 teams see 1-3 yards more often. When you go to the work to combine those categories and refigure the percentage (not seen on that table) you learn that the Cyclones on third down have six yards or less to go 63.64 percent of the time. That is the 2nd best in the country behind Alabama at 64.91 percent.
So what have we all learned here? It isn’t really a matter of the turtle winning the race but it is a good example of a team staying on schedule and ultimately moving the chains. The first down numbers aren’t great. The second down numbers are only slightly better but show through the distribution that 2nd & long is usually avoided. But the third down numbers show how frequently the Cyclones see third down with six yards or less to get a first down, a very manageable situation.
The lack of explosion does tend to put some pressure on the offense and put them in tight spots but all in all it has worked well enough to keep the offense on the field. Plus, remember that only recently or in quick spurts early in the season did it seem like the offense has begun to click while these numbers account for the season as a whole.
Mark Mangino has the offense staying ahead of the chains and moving them more often than most when it gets to crunch time. That is a result of often gaining some yards, even if comparatively low to the rest of FBS, to keep things on pace. Of course, the trick is turning conversions into points and maintaining that consistency of keeping the schedule if explosive points will be few and far between.


