
By Kirk Haaland of enCYCLONEpedia.comFollow Kirk on Twitter @Khaal53
There were a number of ugly facets to the Cyclones game on Saturday with Oklahoma and thankfully one of them was not the scoreboard. Iowa State kept the Sooner offense in check and out of the end zone — even when it came to the vaunted “Belldozer” (which succeeded roughly half the time despite the hype of one ESPN writer that I exchanged tweets with on Saturday).
The Cyclone offense struggled to get receivers open and move the ball consistently, while turnovers were also a problem. The other glaring issue on the day was penalties, specifically false starts. With a few people asking if I had been tracking false starts this year (I hadn’t), I figured it would be a worthwhile venture to dive into just how bad penalties have been with a focus on the false starts.
First the criteria I used: I only counted penalties that were accepted. I considered a penalty to be a “drive killer” by the offense somewhat subjectively but one qualification was that a first down could not have been earned following the penalty. I did not have a similar distinction for defensive penalties but could have. A fair number of penalties were not attributed to a specific player in the game logs for whatever reason; in those instances I just credited it as a team penalty.
Here’s what I found:
- ISU has had 80 penalties on the year for a total of 625 yards.
- 23 of those penalties have been false starts and two more have been illegal procedure.
- Of those 25 penalties, six were attributed as “team” infractions but next is Kelechi Osemele with five false starts, Hayworth Hicks with three false starts, Kyle Lichtenberg with two false starts and everyone else noted has just one.
- Also of note is that 12 of the false starts have occurred at home.
- Of the 80 penalties 46 have been against the offense, 27 have been against the defense, & seven have been on special teams.
- With 46 of the penalties coming against the offense on 876 total offensive plays run, a penalty occurs against the offense once every 19.04 plays. For the defense and there 27 penalties on 853 plays a flag flies once every 31.59 plays.
- The offense has been penalized for a total of 339 yards, the defense has been penalized for 247 yards and special teams has been penalized 44 yards.
- Here is the breakdown by variety of penalty, total occurrences, and total yards:

Of the 46 offensive penalties, I dubbed 15 of them as “drive killers.” On those 15 occasions, the Cyclone offense could not recover to get a first down after the penalty was enforced. Fifteen out of 46 at least seems pretty high to me while having nothing else to compare to. Basically, one out of every three offensive penalties aided in halting a drive.
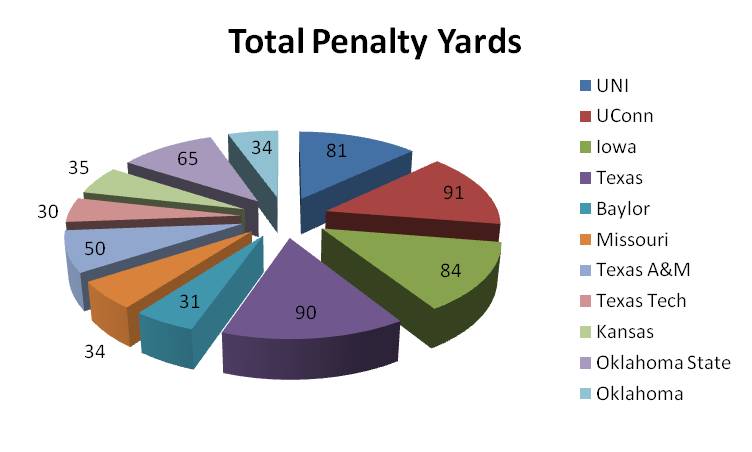
To start the season, ISU registered 50 penalties for 411 yards for an average of 8.3 penalties per game and 68.5 penalty yards per game. In the past five games that has improved to six penalties per game and 42.8 penalty yards per game. Here are a couple of pie charts to help see the improvement:


I’m not usually one to single out players for negatives to shine a light on what they haven’t done well. I am, however going to make an exception by posting the total penalties by player and the corresponding yards just for the sake of information. I will allow you to draw your own conclusions.

In terms of national or Big 12 perspective, I can’t offer up much on the basis of a penalty-by-penalty breakdown on percent of offensive snaps with a false start, but I can give the broad comparison with penalties across the board.
Here is the Big 12 outlook on penalties per game, penalty yards per game, the average yardage for a penalty, and the frequency of penalties occurring (one in however many plays):

Nationally, ISU is the penalized at the 44thmost frequent rate with their penalty once per every 21.61 plays. That isn’t the best but it also could be much worse. For instance, consider the types of penalties that ISU is hit with most often.
While there have been many hair-pulling personal fouls the total damage is actually rather benign. When looking at the average yardage per penalty Iowa State is 106thwith just 7.81 yards per penalty. Some of that may be random occurrence because of the affects of some penalties being half the distance instead of the full enforcement, but it does show that while ISU is being penalized frequently they are not being hit with the most damaging yardage wise.
Interestingly, with just one regular season game remaining there isn’t really a divide between penalties occurring more or less frequently in home games versus road games. Of the 80 penalties for 625 yards:
- 46 of them have occurred for 405 yards at home and…
- 34 of them have occurred for 220 yards on the road
There is a discrepancy in the yardage for penalties but the frequency has been roughly the same or worse for home games. That is with one road game remaining, obviously. One interesting note between home and road games however, is that of the 10 personal foul/unsportsmanlike conduct penalties, eight of them have occurred at home.
There you go fanatics. There is more there to share but in the interest of self preservation and stopping short of over analysis, I’ll leave it to your own analysis now. If there are any other angles you’d like to see or questions you may have, please let me know.


